
Which way is fair, which way is not?
The journey of Artificial Intelligence (AI) consists of so many ups and downs, so do AI fairness. There is mostly an exciting pulse causing an up-ing wave in AI research. In this post, we are going to deep dive into one of these “thought provoking” pulses in AI fairness.
Introduction
In 2016, ProPublica an investigative journalist newsroom, published an article -Machine Bias- showing that the software to predict future criminals was biased against black people. The technical details for this analysis can be found in [1] and [2].
In contrary to what ProPublica found, another group of detailed analysis argued that ProPublica is misleading the tool as well as the results in [3 ], [4], [5] and [6].
Background
To “roughly” understand the debate we need a little bit of technical explanations.
Calibrated Scores. A rule of thumb in statistical risk assement tools is calibrating the scores. Suppose your weather forecasting app predicts 40 percent of rain for today, how do you scientifically measure the goodness of this prediction? You need to collect data points… If you have 100 days of prediction with 40 percent rain, and approximately 40 of them actually rains, then your predictions are statistically calibrated. Hence, your risk asssement for rain is scientifically fine.
Balance for Classes. Suppose we have two group of people, group X and group Y and the same risk prediction system predicting individuals as high risk-positive- (HR) or low risk-negative- (LR).
- Average score for the HR predicteds from group Y should be equal to average score for the HR predicteds from group X. This is similar to saying True and False Positive Rates should be equal across groups.
- Average score for the LR predicteds from group Y should be equal to average score for the LR predicteds from group X. This is similar to saying True and False Negative Rates should be equal across groups.
These two constraint must be true to hold Balance for Classes.
What is really going on?
What ProPublica did is -roughly- showed that Balance for Classes is not hold in the software[1]. Yet, what the company build the software argued their tool’s scores statistically calibrated. Yet, research stimulating question has arrived:
- Can we achieve both criteria simultaneously?
Chouldechova [8] and Kleinberg et al. [7] came out to elaborate problem of achieving these notions of fairness simultaneously.
Problem formulation
We are going to walk through a simplified version of the same example Kleinberg explains in his talk.
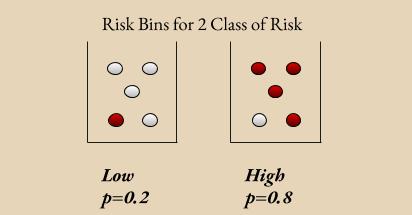
Suppose you have a system predicts Low Risk(LR) or High Risk(HR) for individuals. For LR individuals you know that the probablity of being risky is 0.2, similary 0.8 for HR ones. If you put every LRs to a single bin and HRs to another bin, you should have the ~0.2 proportion of actually risky individual in LR bin and ~0.8 in HR bin. In Figure 2, there are 10 invidiuals half of them predicted as HR, and the rest LR. 4 out of 5 individuals are actually risky in HR bin, and vice versa for LR bin. Thus, scores are calibrated in this system.
I am going to use the same notation with Kleinberg et al. [7]
$bin_L$: Low bin, where every individual predicted as low risk
$bin_H$: High bin, where every individual predicted as high risk
$p_{bin_L}$: probability score, 0.2 in our case, of being LR in given individual in $bin_L$
$p_{bin_H}$: probability score, 0.8 in our case, of being HR in given individual in $bin_H$
$b_L^t$: total score in $bin_L$ for group t
$b_H^t$: total score in $bin_H$ for group t
$k_t$: number of people in group t and belongs to risky (positive) class
$N_t$: total number of people in group
One can deduce from the equation (1) that calibration implies the total score in any given bin is equal to expected number of people actually in risky class in that bin for group t. Total score for $bin_L$ and $bin_H$ are $0.2*5=1$ and $0.8*5=4$ respectively, where these numbers are equal to actually risky (red) individuals in those bins. Now assume we have only one group in Figure 2, in other words everybody is coming from the same group. Hence, summing total scores over all bins gives the total number of people belonging to risky class:
As to make formulation even more clear, let’s have our final two definitions, please note that the above definitions are group independent:
$x$: The average score of an individual predicted in the nonrisky (negative).
$y$: The average score of an individual predicted in the risky (positive).
$n_{b_{risky}}$: Number of actually risky people in bin b.
$n_{b_{nonrisky}}$: Number of actually nonrisky people in bin b.
If we apply equations (3) and (4) in our example in Figure 2:
We know from equation (2) that summing scores over all bins gives the total number of risky (positive) people in that group. Moreover, we know that the total score for a group t is equal to summation of total scores from risky (positive) and nonrisky (negative) classes:
Equation (5) indicates a line with a slope of proportional to $\frac{k_t}{(N_t - k_t)}$. Okay, but wait what is this slope? Yes! It is the rate of risky individuals to nonrisky individuals. To achieve calibrated scores we need this equality. However, slope trend shows that ($x$, $y$) driven from have different lines, based on the slope or risky proportions, which causes not to have class balances for different groups.
As a result, if we have a two grouped version of the same system, with different rates of risky individuals and the Scores are Calibrated, it is impossible to achieve equal Balance for Classes condition.
Results
We can now esaily claim that it is “impossible” to achieve what ProPublica argued as unfair because the company making this software is calibrated the scores with data having two different rates of risky individuals for black and white people.
Last but not least, along with this work Chouldechova [8]’s paper also proved again “impossibility” of reaching multiple (more than 3) predefined fairness criteria instantaneously. It is common wisdom isn’t it:)
Conclusions
ProPublica’s contradictory analysis on a software helped to discover new territories in huge adventurous AI-Fairness land. Yet, we clearly learned there are trade-offs in such risk assessment tools. If you are interested in math and probability Simpson’s paradox is a very interesting topic to discover!
References:
[1] ProPublica Article
[2] ProPublica Analysis-doc
[3] William Dieterich, Christina Mendoza, and Tim Brennan. COMPAS risk scales: Demonstrating accuracy equity and predictive parity. Technical report, Northpointe, July 2016.
[4] Northpointe Technical Report
[5] Anthony Flores, Christopher Lowenkamp, and Kristin Bechtel. False positives, false negatives, and false analyses: A rejoinder to “machine bias: Theres software used across the country to predict future criminals. and its biased against blacks.”. Technical report, Crime & Justice Institute, September 2016.
[6] Abe Gong. Ethics for powerful algorithms 1 of 4. Medium, July 12, 2016
[7] Jon Kleinberg, Sendil Mullainathan, and Manish Raghavan. Inherent trade-offs in the fair determination of risk scores. arXiv, 2016.
[8] Alexandra Chouldechova. Fair prediction with disparate impact: A study of bias in recidivism prediction instruments. arXiv, 2017.
[9] ProPublica Inevitable Bias Article